
Ask. Solve. Share. is our practical series built from challenges we see with our client partners. We work alongside their teams to diagnose what is happening, agree on a safe path to fix it, and then, in the spirit of open source, share the learning with the wider community so others can benefit too.
Ask: The “can’t replicate it” performance report
During our monthly account champion meeting with one of our university partners, a support scenario came up: a staff member reported that a specific Moodle course felt “really slow”. While the issue was real for them, nobody else could reproduce it, and there were no obvious site-wide speed problems.
It is a pattern many higher education teams will recognise: reports that are real for one person, but hard to reproduce for everyone else.
That is a frustrating place to be:
- Support teams lose time trying to “guess the issue”
- The person reporting the issue feels dismissed
- Platform teams get pulled into a debate without shared evidence
The biggest challenge is not always diagnosing and resolving a performance problem, sometimes it can be identifying it in the first place and narrowing down exactly where and when it is happening.
What makes this hard in universities is that the challenge is not always fixing performance, it is spotting it early and narrowing down where and when it happens. With lots of plugins, integrations, and locally-created content, there are more moving parts that can interact in unexpected ways. Add in user-generated content (for example, very large images used as course thumbnails), and it becomes easy for “small” decisions to create a slow experience in specific areas. Finally, what happens on a user’s laptop or network is not always visible from the server side, and some slowness is completely expected (like uploading a large video), which can confuse the investigation.
So we started with a simple question: what evidence do we have that can help us diagnose this without guesswork?
Solve: Use Matomo to turn a vague complaint into a diagnosable signal
In this situation, our teams used Matomo to create shared evidence of what was happening.
Matomo is a site analytics service provided by Catalyst. It is similar in capability to Google Analytics, but it is hosted on Catalyst’s servers with no data released to third parties.
It is also an ethical alternative designed around data ownership and privacy protection. In Catalyst’s implementation, cookie collection is disabled, so no tracking of individual users takes place.
Why privacy-safe, aggregated analytics matters in universities: the goal is not surveillance. It is anonymised evidence that helps teams improve platform experience, particularly for performance debugging and usage patterns. It lets teams understand what is happening at a page or journey level without turning measurement into individual monitoring.
Step 1: Make sure the right people can see the evidence
The institution already had Matomo, but the people receiving “it is slow” reports did not realise they could use it day to day. We created accounts for the support/digital learning roles who needed to investigate.
Not everyone needs analytics access. The key is identifying the few roles who regularly receive performance reports and are expected to act on them, and making sure those people can see the same evidence. Done well, this reduces noise, avoids over-sharing, and speeds up diagnosis.
That single step changed the dynamic from “We cannot replicate it” to “Let’s see if we can narrow it down”
“Access is case by case. The important part is that people know the option exists, and if they have not used Matomo or Google Analytics before, they get a quick walkthrough of what they can see and how it helps.” Jakub Chromec, Digital Learning Consultant
Step 2: Use Page Performance to separate “slow” into the real cause
The most useful report here was Matomo’s Page Performance metrics. It breaks page load experience into components that show where the time is going:
- Avg network time: delay between the user and the site (often connection/location/device/VPN context).
- Avg server time: how long the platform takes to respond (backend performance).
- Avg DOM processing time: how hard the browser works to render the page (page/course complexity).
- Avg on load time: the end-to-end “felt” experience (useful headline, but not diagnostic on its own).
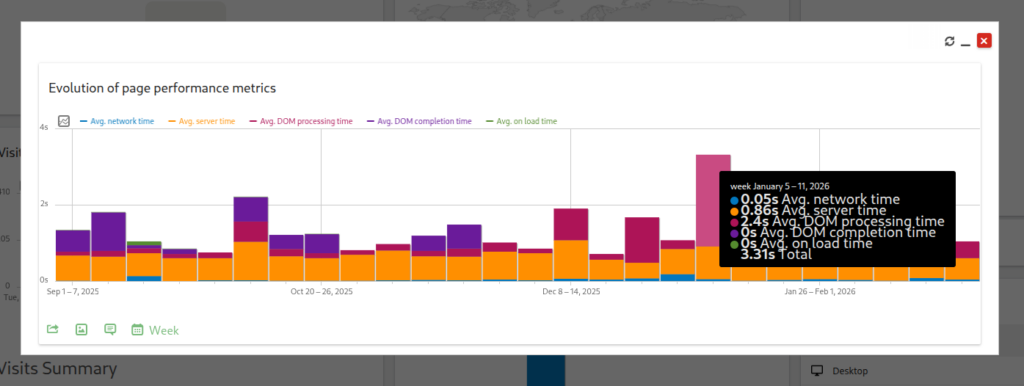
If you only take one thing from this post, it is this: “Slow” is not always one problem. Often, it can be several, and each one needs a different response.
Step 3: Look for patterns you can act on
Once you have the performance breakdown, Matomo helps you validate patterns quickly:
- Where visitors are coming from and which pages they access most
- Whether certain browsers/devices correlate with the issue
- Whether it is happening right now (real-time view) or is part of a trend (over time)
If you do not have Matomo (or do not have access yet)
You can still use the same approach; you just need alternative signals.
Start by capturing:
- Which page feels slow (exact URL or page type)
- When it happens (date/time window)
- Who experiences it (one person, cohort, location, device type)
Then:
- Try a different network/device/browser (network/context clues)
- Check whether multiple users see it at the same time (platform response clues)
- Compare the slow course to a simpler one (page complexity clues)
If you want to diagnose faster and more consistently, Matomo gives you that breakdown without relying on ad-hoc testing.
Share: A decision tree your team can use every time
If it looks like a network or user-context issue…
Likely causes: connection, VPN/proxy, geography, device constraints.
Next step: confirm whether it follows the user or clusters by location/setup.
If it looks like a server or platform response issue…
Likely causes: load, caching gaps, database contention, scheduled jobs, and change impacts.
Next step: correlate with peak windows and recent changes.
If it looks like a page rendering or complexity issue…
Likely causes: heavy course pages, complex layouts, theme behaviours, too many blocks/widgets.
Next step: compare with a simpler course; treat it as course/page design optimisation.
If it is slow overall but inconsistent…
Likely causes: mixed contributors, intermittent issues, third-party dependencies.
Next step: prioritise the biggest contributor first, then reassess.
The takeaway: the fix is shared visibility, not louder debate
The real improvement here was not just the report but giving the right people access to evidence and a shared method. Once that was in place, the conversation moved from “Is Moodle slow?” to “What is slow, for whom, and why?”
That is how partner teams move from fire-fighting to continuous improvement.
If you want to make this kind of evidence-led performance diagnosis repeatable with the right access, reporting habits, and support behind your team, start with the Moodle Educators Pack, which includes a Matomo Analytics Dashboard for privacy-friendly, open source engagement and usage tracking.